In 2024, card payments in the European Economic Area (EEA) came to about 111 billion transactions, of which about 17.06 million were fraudulent.
That is 0.015% by count and 0.033% by value, according to a report the European Banking Authority (EBA) and the European Central Bank (ECB) published in December 2025. A fraud model has to pick out one or two transactions in ten thousand, and it has roughly 100 milliseconds to decide before the payment is approved.
My previous post on transformers in credit looked at how models that read transaction histories as sequences are entering credit scoring. The same shift is under way in fraud detection, but the conditions are different. Fraud is far rarer than default, the tactics keep changing, and labels arrive late. So alongside sequence models, it is worth looking at anomaly detection, which works without labels, and at graph methods for finding fraud rings.
1. How rare fraud is
The EBA and ECB report puts total payment fraud in the EEA in 2024 at €4.2 billion, of which card fraud was €1.3 billion. About 83% of card fraud by value came from remote payments such as online purchases, while remote payments make up only about 28% of card payment value. The fraud rate for remote card payments was 0.091% by value, more than ten times the 0.007% for in-person payments.
Label delay matters just as much. A Worldline team measured it on production data in a paper at AISTATS 2022. Only about 1% of fraudulent cards were blocked within an hour of the first fraudulent transaction, and fewer than 30% within a day. Most were blocked within a week to ten days, because a transaction is labelled as fraud only after the customer disputes it and the dispute is confirmed.
A 2018 paper by Dal Pozzolo and colleagues in IEEE TNNLS traced the difficulty of fraud detection to three conditions: the data distribution drifts as tactics change (concept drift), the classes are extremely imbalanced, and labels are verified late. Since investigators can review only a handful of alerts a day, its recommendation was to measure precision on the top alerts rather than AUC.
Because of these conditions, the card industry measures fraud detection by how much fraud value is caught for a given number of legitimate cases wrongly flagged. Flagging five legitimate cases for every fraudulent one is called 5:1. Whether a case is an account or a transaction depends on the company and the metric: FICO uses the account-level AFPR (account false positive ratio), while Visa’s LTM brochure does not state the unit. The share of fraud value caught at a given operating point is the value detection rate (VDR).
2. Fraud models that read transaction sequences
The most detailed public example is WeChat Pay’s PANTHER. In a paper at NeurIPS 2025, the team pretrained a transformer on 5.3 billion transactions from 38 million users over six months. The task is to predict the next transaction, and each transaction becomes a single token that combines attributes such as merchant category and amount bucket.
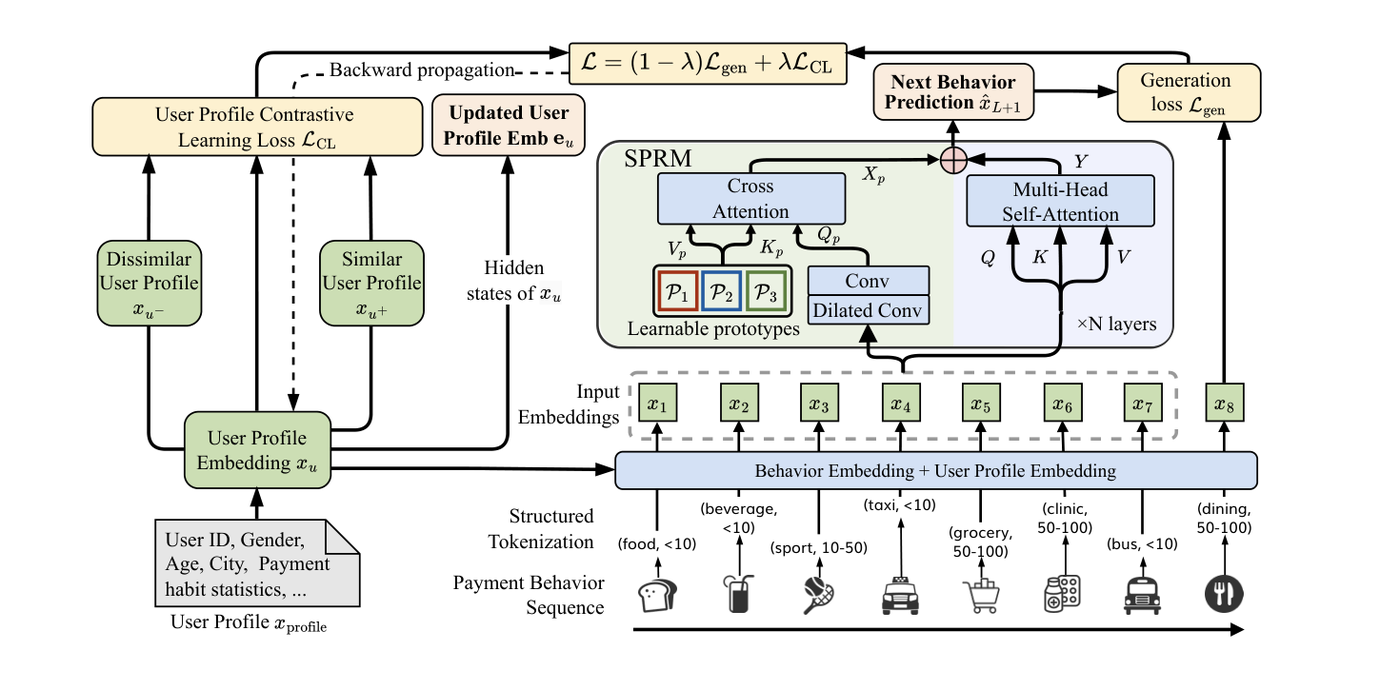
Payment behaviour sequences are turned into (merchant category, amount bucket) tokens to predict the next action, and a user profile embedding is learned alongside them through contrastive learning. (Source: PANTHER, arXiv:2510.10102, CC BY 4.0)
The way it goes into production resembles Affirm’s approach from the previous post. A user embedding and a deviation score, which measures how far the current transaction departs from the user’s usual behaviour, are extracted from the pretrained model ahead of time. The real-time decision is made by a discriminative model, typically a DCN, that takes these two values together with recent transaction patterns and transaction context. The A/B baseline was the DeepFM model already in production, built on hand-crafted features and a TextCNN sequence encoder.
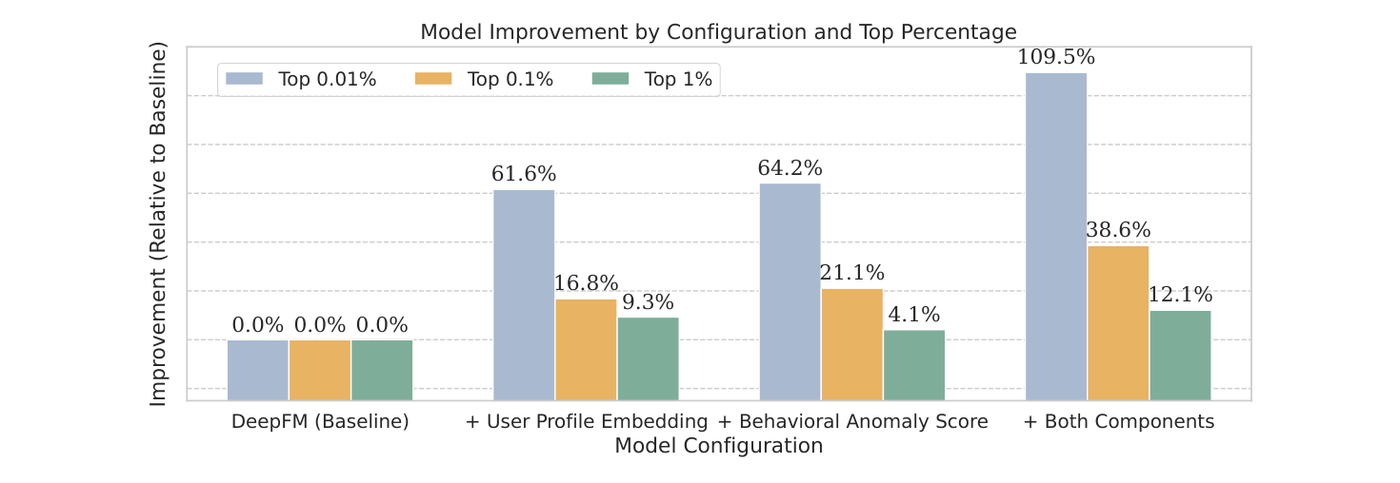
Relative improvement in fraud recall over DeepFM, measured on the top 0.01%, 0.1% and 1% of risk scores. (Source: PANTHER, arXiv:2510.10102, CC BY 4.0)
WeChat Pay ran a ten-day A/B test on full traffic in its production system. Fraud recall rose by 109.5% in the top 0.01% of risk scores, 38.6% in the top 0.1% and 12.1% in the top 1%. Adding the embedding and the deviation score together worked better than adding either one alone. Latency rose by 5ms over the baseline and stayed within the 100ms budget. Interpretability remains a limitation, since the representations are complex, and the paper leaves it for future work.
Stripe also announced a payments foundation model in 2025, trained on tens of billions of transactions. Each transaction is compressed into an embedding, and a classifier over sequences of these embeddings catches card testing, in which fraudsters make small payments to check whether stolen card details work. The detection rate for attacks on large users rose from 59% to 97%, measured on a subset of sophisticated attacks.
Visa, after acquiring Featurespace, introduced large transaction models (LTMs). In a proof of concept on North American card-not-present transactions, an LTM caught more than five times as much fraud value as a production GBT model at the same 5:1 point. A footnote describes the results as illustrative. Revolut’s PRAGMA had 64.7% higher fraud recall and 16.7% higher precision than the task-specific baseline.
Sardine, a fraud prevention company, gave a fairly candid account in September 2026 of how it built a model for card issuers. A transformer was pretrained without fraud labels by predicting the next transaction, and its embeddings and a surprise score were added as inputs to the existing 77-feature XGBoost model. At the same alert rate, the model caught 24 to 35% more fraud. The first version actually performed worse, and the existing model was never swapped out for a neural network.
Mastercard unveiled a large tabular model trained on billions of transactions in March 2026, along with plans for a hybrid system combining its existing AI models with the new one. No performance figures were given.
PANTHER and Sardine, which disclosed how they deploy their models, kept their existing models, and Mastercard is planning a hybrid. In each case, embeddings or deviation scores from the foundation model are added as features to an existing tree or deep learning model.
3. Why tree models are still here
The evidence on the other side is fairly solid too.
Block, which runs Cash App and Square, published its BlockTabBench results in August 2026. It compared PR-AUC on more than 100 internal risk datasets, covering problems such as scams and account takeover, with time-based splits. XGBoost was best on 41% of the datasets, the tabular deep learning model TabM on 37% and tabular foundation models (TabFM) on 22%. The foundation models won mostly on datasets with few labels. Block concluded that XGBoost is a sensible default when it performs close to the ceiling. The comparison used engineered tabular features, not raw sequences.
Adyen explained in 2024 that its fraud detection runs on tree-based ensembles. The data is mostly structured and tabular, so boosting with hundreds of features already gives a strong baseline, and once operational load, reliability and latency are counted, Adyen had not yet seen proof that deep learning improves ROI. Average latency is 20ms and p99 is 100ms.
Visa’s own LTM brochure credits GBTs with faster deployment, easier interpretation and good performance on little data. In Sardine’s view, explainability could be a show-stopper, and outside card issuing the benefits of foundation models may shrink or disappear. That is probably also why PANTHER was layered on top of the existing model in production. Adding only the signal from sequences while meeting latency and explainability requirements is easier to run.
4. Anomaly detection without labels
All the models so far learn from fraud labels confirmed in the past. When a new tactic appears, it takes time for labels to build up, and losses mount in the meantime. Anomaly detection, which looks for what is unusual without labels, fills that gap.
A common choice in practice is Isolation Forest, published at ICDM in 2008. Instead of modelling normal data, it isolates outliers by splitting the data at random again and again. Outliers are few and far from the rest, so they are isolated quickly near the root of the trees, and the shorter the average path length, the higher the anomaly score. On the neural network side, a long-standing approach is to train a model to reconstruct the data and treat transactions with large reconstruction error as anomalies. A 2002 paper by Hawkins and colleagues, which used replicator neural networks (structurally the same as autoencoders) for outlier detection, already named fraud detection as a key application.
ADBench, published at NeurIPS 2022, compared 30 algorithms on 57 datasets. No unsupervised method was statistically better than the rest, and which method won depended on the type of anomaly. LOF was best on local anomalies, which stand out from their neighbours, and kNN on global anomalies, which lie far from the overall distribution.
Labels made a large difference. On real datasets, with labels for just 1% of anomalies, most semi-supervised methods beat the best unsupervised method. When anomalies of each type were synthesised and compared separately, however, label-informed methods clearly won only on clustered anomalies. For the other types, knowing the anomaly type in advance and choosing the matching method was sometimes better than having a few labels. ADBench also includes a public card transaction dataset with a fraud rate of 0.17%.
5. Choosing a model without labels
KDD 2026 was held in Jeju in August. At its Machine Learning in Finance workshop (MLF 2026), I attended an invited talk by Leman Akoglu of CMU, “Advancing Outlier Detection with Foundation Models”, on anomaly detection with foundation models for tabular data. The research starts from the model selection problem. Without labels, there is no basis for choosing which detector to use or with which hyperparameters, and the group’s FoMo-0D paper names this as the key bottleneck in anomaly detection. The 0 in the name stands for zero-shot: the model is not trained again on each new dataset.
Akoglu’s group has worked on this problem for years. A review it published in SIGKDD Explorations in 2023 tested internal evaluation methods for selecting models without labels, on 39 tasks with 297 candidate models. None of them turned out to be practically useful. Standalone strategies were statistically indistinguishable from random selection, and strategies built on consensus across models did no better than Isolation Forest with default settings. Methods such as MetaOD (NeurIPS 2021) choose a model by meta-learning on past labelled benchmarks, but they still borrow labels from other data.
The approach in the talk was a foundation model for tabular data. It is pretrained only on synthetic data, with no real data at all. On a new dataset, it judges outliers in a single forward pass, with no further training or hyperparameter tuning. The group’s first model was FoMo-0D, published in TMLR in 2025, followed by OutFormer at ICML 2026.
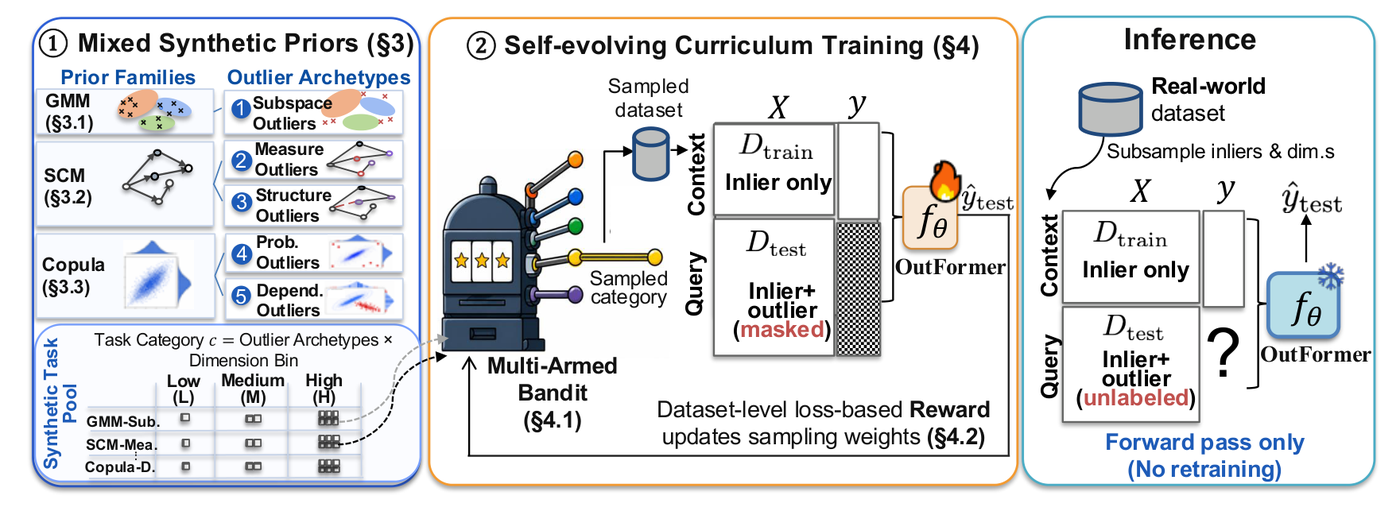
Pretrained on synthetic data from Gaussian mixtures, structural causal models and copulas, with several types of outliers. A multi-armed bandit controls the training order, and on real data the model only runs a forward pass. (Source: OutFormer, arXiv:2602.03018, CC BY 4.0)
OutFormer is a 10-layer transformer with 45.1 million parameters. Given a new dataset’s training data as context, it judges whether each row of the test data is an outlier. The group’s MacrOData paper appeared at the main KDD 2026 conference. To address the fact that ADBench has only 57 datasets, it built three new benchmarks with 2,446 datasets in total.
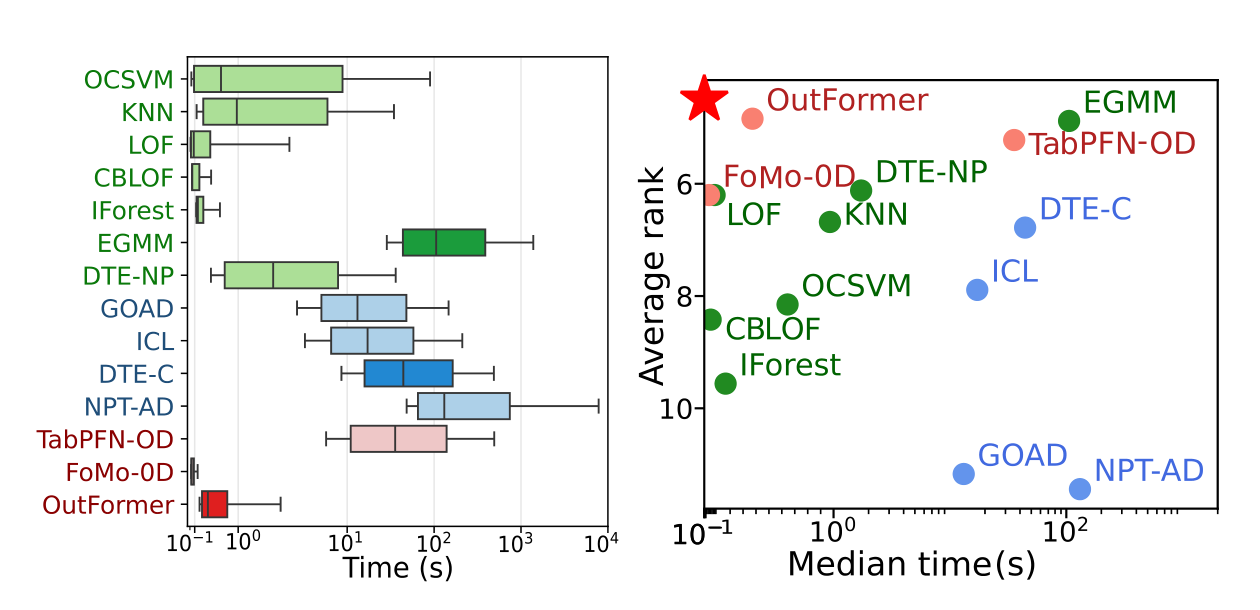
Running time by method across all datasets (left), and average rank against running time (right). The foundation models FoMo-0D and OutFormer are both fast and highly ranked. (Source: MacrOData, arXiv:2602.09329, CC BY 4.0)
Across MacrOData’s 2,446 datasets, OutFormer had the best average AUPRC rank (4.84), with the classical method EGMM (4.88) almost level. Next came the TabPFN-based detector (5.22), FoMo-0D (6.20) and kNN (6.68), with Isolation Forest well behind at 9.56. Deep anomaly detection methods were sensitive to hyperparameters and did worse than classical ones. Foundation models avoid this problem because they do not need hyperparameters chosen for each dataset.
These numbers need some care. In the OutFormer paper, OutFormer had the best average AUROC rank on ADBench at 4.02, but its differences from the TabPFN-based detector (p=0.12) and kNN (p=0.06) were not statistically significant. On AUPRC across all datasets, including the new benchmarks, its differences from every baseline were significant. None of these benchmarks contains real transaction flows from a card issuer or payment company, either. Real fraud data has a much lower outlier rate, and its distribution shifts over time.
6. Fraud rings do not act alone
The methods so far look at one transaction or one customer at a time. Fraud rings that run many accounts, and money laundering, show up only when you look at the relationships between customers. Revolut’s PRAGMA was 47.1% worse than the production model on F0.5 for anti-money laundering. The baseline used network information across customers, and the authors themselves point out that representations of individual customers may not be enough for such a relational task.
A representative graph method is FRAUDAR, published at KDD 2016 by Christos Faloutsos’s group at CMU. It starts from the observation that fraudulent accounts form dense blocks in a bipartite graph that links users to targets such as products or accounts. To avoid detection, fraudulent accounts also link to normal or popular targets. The paper down-weights targets with many connections, so that adding such camouflage edges does not lower the score of a fraudulent block. On a 2009 Twitter graph, most of the account blocks the method found were advertising follower-buying services.
In practice, graph signals are often turned into features rather than putting graph neural networks straight into production. Alipay’s GraphFAS (CIKM 2026) builds interpretable graph features that reach neighbours several hops away, selects the useful ones and feeds them into a tree model. The work starts from the problem that graph neural networks had been hard to interpret and costly to deploy in financial risk management.
7. My view
If this approach were brought into fraud detection systems (FDS) in Korea, I think the order would matter.
The first step is to add embeddings and deviation scores from a transaction sequence model to the existing model as features. PANTHER and Sardine took this route, and Mastercard has said it is heading the same way. It adds the sequence signal while keeping latency and explainability requirements. Block’s and Adyen’s results suggest that XGBoost on well-built tabular features is harder to beat than it looks. When a new model is added, the numbers to look at are those measured on data with a realistically low fraud rate, at the operating point used in production (5:1, for example).
Catching new tactics needs anomaly detection, and there the hardest part is model selection. Without labels, there is no way to check which detector is good, and Isolation Forest with default settings is a surprisingly hard baseline to beat. Akoglu’s group’s foundation models try to settle this selection problem in advance through pretraining, which gives them real practical value. There are no validated results on real payment data yet, though. The first step would be to compare them side by side with Isolation Forest and kNN on past fraud cases in our own data.
Label delay needs separate handling. If fewer than 30% of fraudulent cards are blocked within a day, transactions from the last few days have not been labelled yet. Training on that period as if it were all legitimate teaches the model that the newest tactics are normal. How to treat the last few days of training data has to be decided separately from the choice of model architecture.
Fraud rings and money laundering are hard to catch with models that look at one customer at a time. Even with sequence models and anomaly detection, graph features that capture relationships between customers have to be built separately. Because Revolut also published its weak money laundering result, the limits of single-customer foundation models are there to see.
Related posts:
- Where Transformers Fit in Credit Models: Affirm, Revolut, Parafin and Ant
- [FDS] How Does Stripe Judge Payment Fraud in 100ms?
References
- 2025 Report on Payment Fraud (EBA and ECB, 2025-12)
- The Importance of Future Information in Credit Card Fraud Detection (Nguyen et al., AISTATS 2022)
- Credit Card Fraud Detection: A Realistic Modeling and a Novel Learning Strategy (Dal Pozzolo et al., IEEE TNNLS 2018)
- Value Detection Rate: A Performance Metric for Payments Fraud Detection (J.P. Morgan AI Research, ICAPS 2023 FinPlan)
- PANTHER: Generative Pretraining Beyond Language for Sequential User Behavior Modeling (WeChat Pay, NeurIPS 2025)
- Using AI to optimize payments performance with the Payments Intelligence Suite (Stripe, 2025-05-15)
- Card testing (Stripe Docs)
- Large transaction models (LTMs) (Visa)
- PRAGMA: Revolut Foundation Model (arXiv:2604.08649, 2026)
- Foundation models for issuer fraud detection (Sardine, 2026-09-10)
- Mastercard’s new generative AI model (Mastercard, 2026-03-17)
- BlockTabBench: Evaluating tabular models across Block’s machine learning ecosystem (Block, 2026-08-25)
- How Adyen does AI (Adyen, 2024-08-16)
- Isolation Forest (Liu, Ting, Zhou, ICDM 2008)
- Outlier Detection Using Replicator Neural Networks (Hawkins et al., DaWaK 2002)
- ADBench: Anomaly Detection Benchmark (Han et al., NeurIPS 2022)
- KDD 2026 Workshop on Machine Learning in Finance (MLF 2026) speakers
- The Need for Unsupervised Outlier Model Selection (Ma, Zhao, Zhang, Akoglu, SIGKDD Explorations 2023)
- Automatic Unsupervised Outlier Model Selection, MetaOD (Zhao, Rossi, Akoglu, NeurIPS 2021)
- FoMo-0D: A Foundation Model for Zero-shot Tabular Outlier Detection (Shen, Wen, Akoglu, TMLR 2025)
- From Zero to Hero: Advancing Zero-Shot Foundation Models for Tabular Outlier Detection, OutFormer (ICML 2026)
- MacrOData: New Benchmarks of Thousands of Datasets for Tabular Outlier Detection (KDD 2026)
- FRAUDAR: Bounding Graph Fraud in the Face of Camouflage (Hooi et al., KDD 2016)
- GraphFAS (Alipay, CIKM 2026)
Written on 23 October 2026 from papers, company technical blogs and press releases. Performance figures are those published by each company or set of authors, and most are relative changes against their own previous models. Visa describes its figures as illustrative. The MacrOData dataset count is from the latest arXiv version. Paper figures are used under CC BY 4.0.